Once. Just once I would like to find the answer to a problem that has been plaguing me for half a year and cost me hours of trial and error before I plead for help on github. I have an electron app that uses vue and is run with the vue-cli. The rest is more or less magic to me. Unfortunately, WebStorm feels the same way. At least when it comes to debugging.
I tried a lot of different ways to debug the renderer thread from within WebStorm to no avail. Somewhere along the way with Webpack all information seemed lost. So I did a lot of console.log and breakpoints within the Chrome Dev Tools. But it’s actually not only doable, it’s easy.
Change your run config to vue-cli-service electron:serve --remote-debugging-port=9223
Run the config. It will just start your app and do nothing else special.
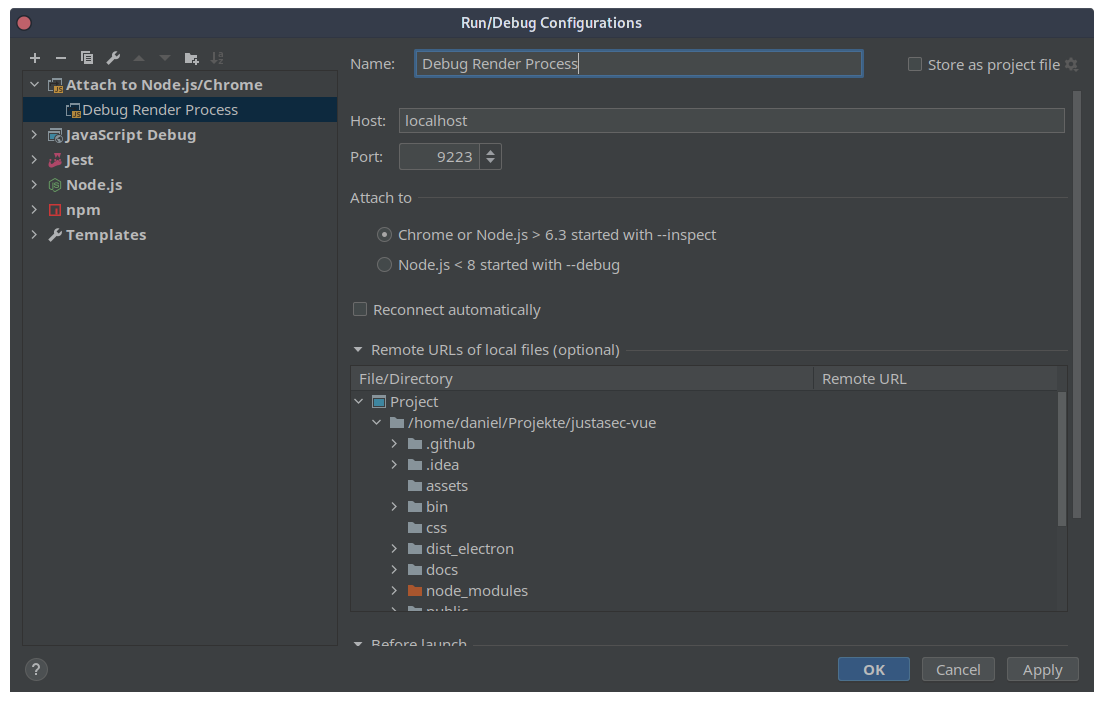
Create a second config. This time a “Attach to Node.js/Chrome” config with port set to 9223
Debug render process render config
That’s it. Now, whenever you want to wait for a breakpoint anywhere in the renderer process, just click the debug button.